


Is a market crash imminent?
Key markets update for 13 December 2024

The probability that we're about to experience a big crash in the markets is 50%: either it will happen or it won't. Jest aside, it is next to certain that the crash will happen - eventually. The problem, of course, is that we can't predict when it will happen, how far the markets might drop or how long the decline could last.
A few weeks ago, I warned about headlines that state something like, "market genius who predicted the last crisis warns of an epic crash ahead." Often, such predictions come true because, with an accuracy of a broken clock, the market genius in question kept predicting something for a considerable time until it finally came true.
Most recently the Yale economist and nobel laureate Robert Schiller (again) sounded the alarm about an imminent market crash. Schiller had famously predicted the bursting of the dotcom bubble in 2000 and the crash of the housing market in 2008, so investors rightly take his warnings very seriously (at the same time, the fact that he'd been predicting the 2008 housing market crash since at least 2005 got lost in the memory hole). With regards to the present bubble, Schiller had been predicting its imminent crash for a while now.
On 23 October 2019, he gave a speech to a gathering of investors in Los Angeles. "I see bubbles everywhere...," said the nobel laureate and author of "Irrational Exuberance." On that day, the S&P 500 closed almost exactly at 3,000. Today, it's more than double that. Schiller's prediction once more corroborates our hypothesis that making predictions on the basis of market fundamentals is at best a complete and total waste of time.
It's not that Dr. Schiller was wrong about the prevalence of bubbles in 2019: they were indeed everywhere. The problem is that five years later, they're still there, and for all we know they might still be there five years from now. As I've repeated here many times, large-scale price events unfold as trends that can span many months and years.
Even if these events qualify as bubbles, these may still continue to inflate for an indeterminate amount of time and reach heights that neither experts like Robert Schiller nor ordinary investors can predict today. The most reliable way to navigate this uncertainty - perhaps the only way to navigate it - is through systematic trend following. The chart below shows how a typical I-System strategy navigated the last boom-bust cycle:
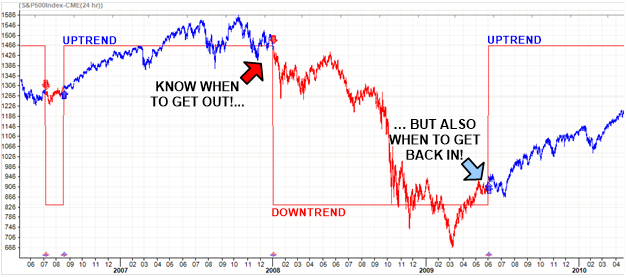
Note, with trend following you would have neither sold at the top in 2007, nor bought at the bear market's bottom in 2009. However, you would have captured a significant windfall through both bull and bear cycles. In 2008, the large majority of traders and investors sustained very substantial losses.
Thanks to systematic trend following and the I-System, the portfolio I was managing at the time returned a 27% positive result to investors (net of fees). Near the peak of today's bubbles, I still believe that investors' best bet might be again to rely on systematic trend following.
Please note, the directional exposure and trading signals for TrendCompass Key Markets portfolio go behind the paywall starting on Monday, 16 December.
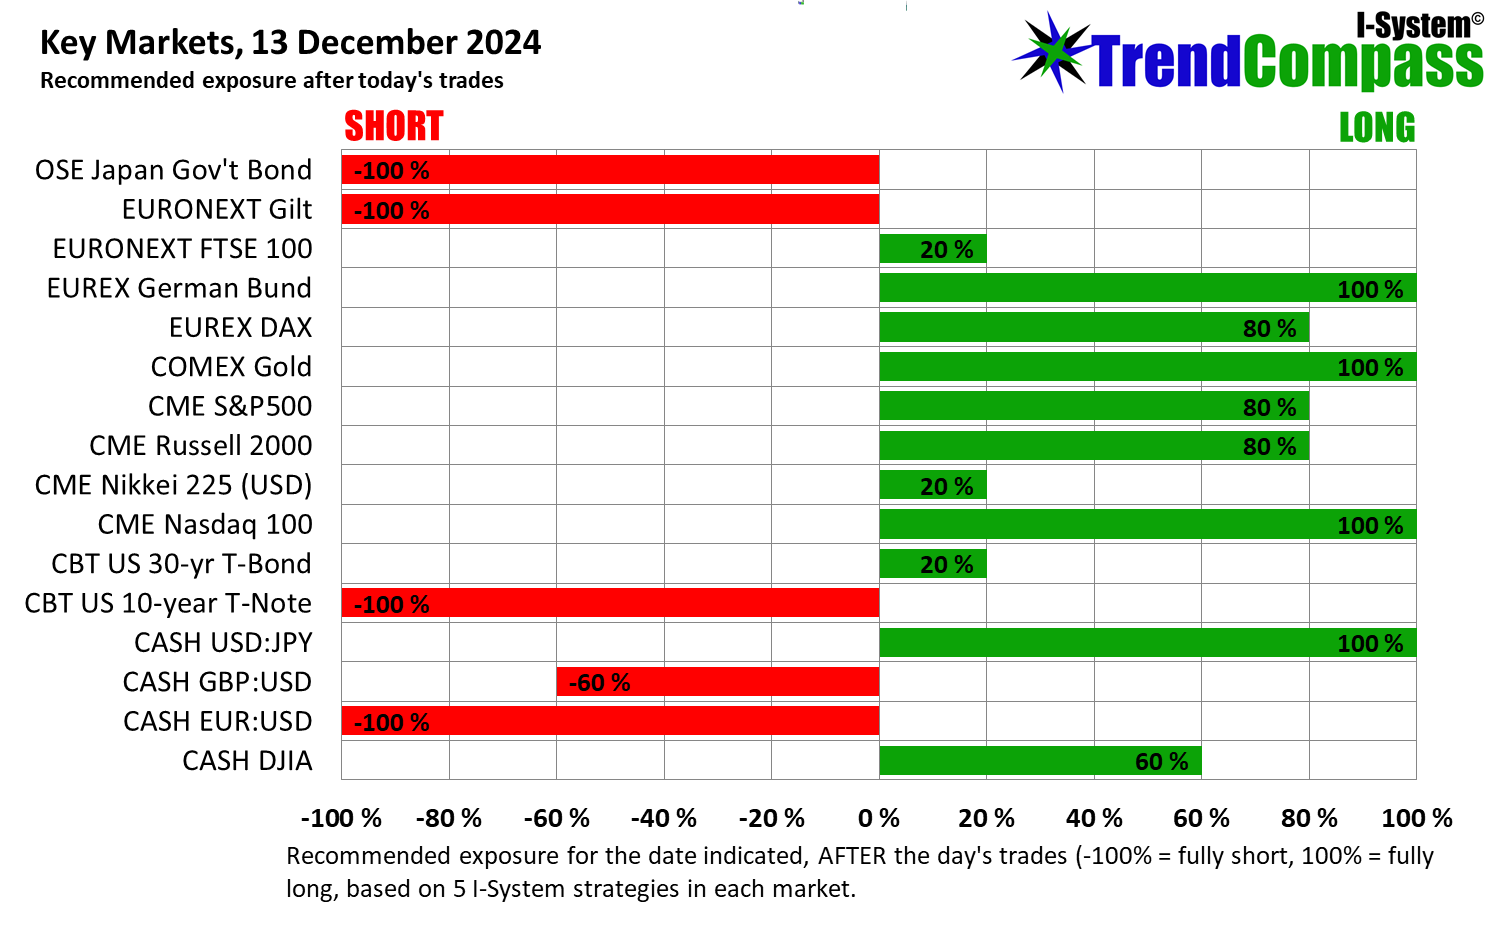
Trading signals for Key Markets, 13 Dec. 2024
With yesterday’s closing prices we have the following signals:

After today’s changes, your exposure should be as follows:
Full Key Markets portfolio report is available at the following link:
TrendCompass Key Markets portfolio report for 13 December 2024
To learn more about TrendCompass reports please check our main TrendCompass web page. We’d encourage you to also have a read through our TrendCompass User Manual page.

Best regards,
Alex Krainer
Bombing Iran on behalf of Israel would spike price of oil sufficiently for major crash