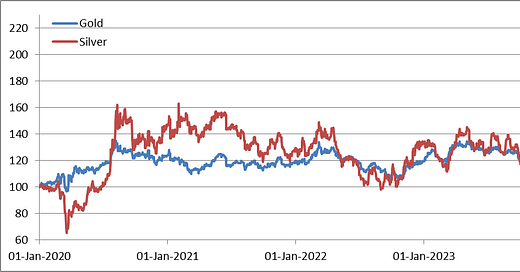
Over the last two years, more or less, precious metals have regained some favor in the markets with both silver and gold close to doubling in price. The chart of daily closing prices below tells the story:
However, the two metals’ fluctuation dynamics have diverged quite a bit: while gold has been distinctly less volatile, silver has been all over the place, at times moving in the opposite direction from gold. This year, silver has been conspicuous by lagging very significantly behind gold, and taking a much more severe beating during the first half of April this year, when both metals experienced a very sharp correction.
Technical picture is strongly bullish
However, there are times when silver leapfrogs gold, as it did in 2020 and 2021, and again in 2024. This suggests that silver could come unglued again and catch up with gold, or even overtake it. I thought it would be interesting to check silver’s daily fluctuations chart for technical clues. Sure enough, it does look like silver is due for a bullish breakout:
Silver prices have trended higher since the start of 2024 and remain firmly in an uptrend (we can ignore the April 2024 crash as an anomaly here). The downward sloping channel that began in late April and has lasted through much of May and it established a support zone from which we had a bullish breakout toward $33/tr.oz. on 21 May. The price has now been consolidating above that breakout level, creating a flagging pattern, the one that’s in the upper right-hand corner of the chart. All these elements constitute a strongly bullish picture, suggesting that we could see Silver catch up with gold, or even leapfrog it over the coming months.
Reaching the trading decisions
That’s the technical analysis of silver price chart. However, best use of technical analysis is not to predict future developments, but to generate trading decisions: if my chart reading is correct, how do I position my risk? At what level should I consider buying? If the trade ends up going against me, at what level do I cut my losses? In the above example, we might buy at the point of the breakout of the downward sloping line. If the trend continues, its upside could be very considerable.
But the trend might not continue, so we need to consider limiting our losses in case we make a bad trade: to do that, we could set our stop-loss level just below the longer-term, upward-sloping line. This is the kind of work that the I-System algorithms do “under the hood,” in order to generate buy or sell decisions. The objective of those decisions is to position our risk so that we can earn windfall profits when and if a large-scale price event does unfold.
That, unfortunately is entirely shrouded in uncertainty: only with time can we find out what happens. But to profit from future events, we must obviously take the risk before they happen.
To learn more about TrendCompass reports please check our main TrendCompass web page. We encourage you to also have a read through our TrendCompass User Manual page. For U.S. investors: an investable, fully managed portfolio based on I-System TrendFollowing is available from our partner advisory (more about it here).
Today’s trading signals
With yesterday’s closing prices we have the following changes for the Key Markets portfolio:
Keep reading with a 7-day free trial
Subscribe to I-System TrendCompass to keep reading this post and get 7 days of free access to the full post archives.


