

Navigating the silver storm
Key Markets report for Monday, 2 February 2026


In Friday’s report, I suggested that I would follow up to explore further “teachable moments” in the silver market. I wasn’t aware yet that additional teachable moments would be in store before the day was over. But before I get to Friday’s roller-coaster, I’ll proceed with the trend following lesson based on the performance of I-System strategies, as illustrated in this chart:
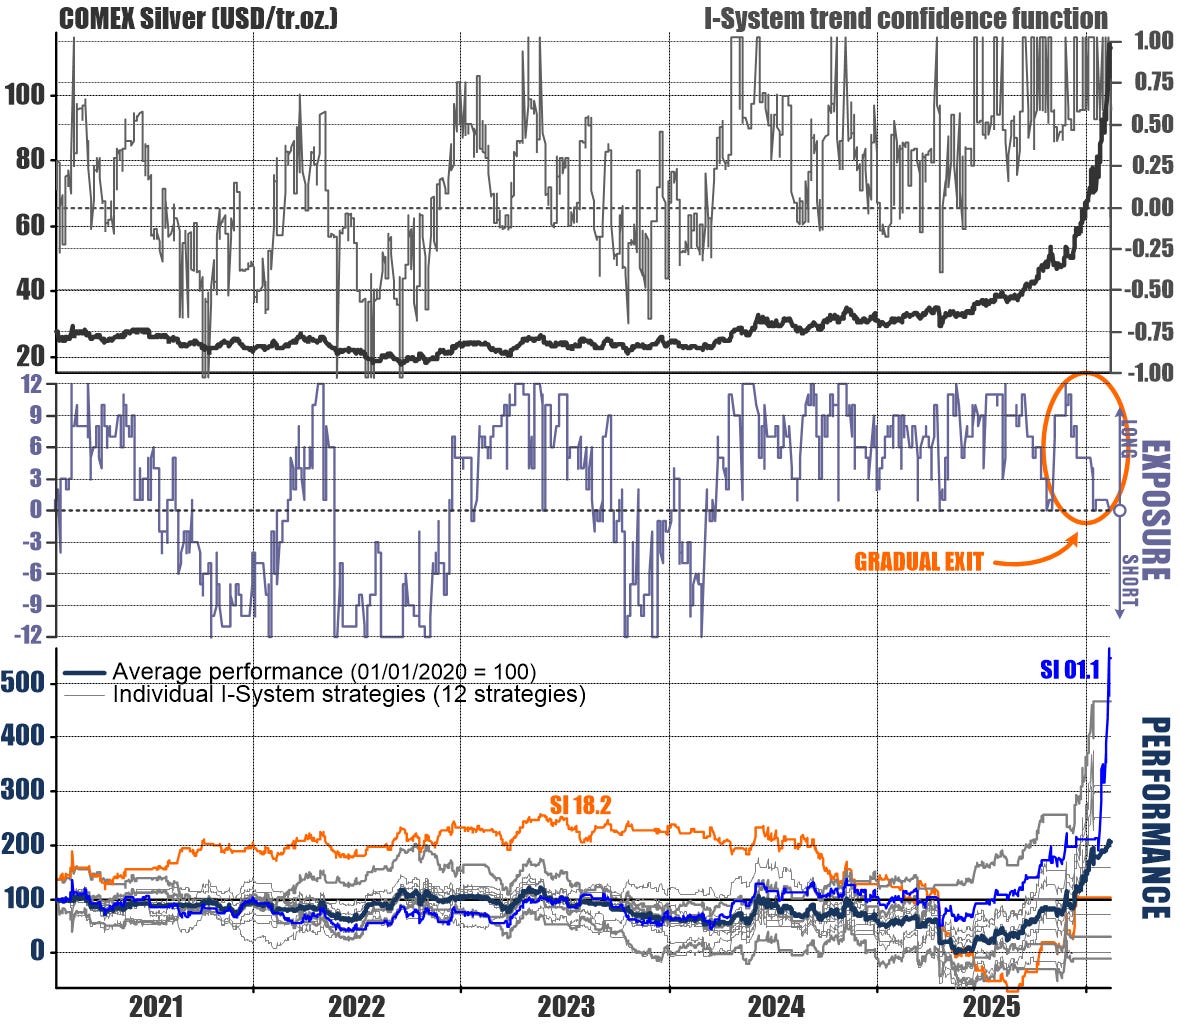
In the bottom panel, showing the trading performance of the 12 I-System strategies for silver included in our Major Markets portfolio, I highlighted two strategies: SI 01.1 and SI 18.2 (again, there is nothing of significance to those names - they’re just codes to distinguish them). As we can see, the SI 01.1 strategy is our best performance while SI 18.2 is among the laggards.
The question frequently pops up, why not just use the best strategy rather than continue to rely on the laggards? Like tomorrow’s price fluctuations, the answer to this question is shrouded in uncertainty. Namely: we can easily measure which strategy performed best in the past, but we have no way of knowing how any one strategy will perform in the future. For a very long time, SI 18.2 was our best performer, but discerning what exactly made it stand out isn’t a simple challenge. At the same time, we can see that Friday’s champion, SI 01.1 spent many years being among the laggards.
As price fluctuations change over time - in some ways, these changes are imperceptible (volatility IS perceptible, but there’s a lot more to price fluctuation dynamics than just volatility) - some strategies will fall out of sync with the market. Other strategies will respond better and this is the reason why we prefer to use a set of strategies rather than any one strategy, regardless of how good we may think it is. Our objective is that average curve, which will never be anywhere near as good as “the best” strategy, but it will also not be among the laggards.
As long as the average generates positive returns over time, the system is doing what it was intended to do. Again, our performance on silver looked underwhelming on Friday morning last week - it looked much better by the market close:
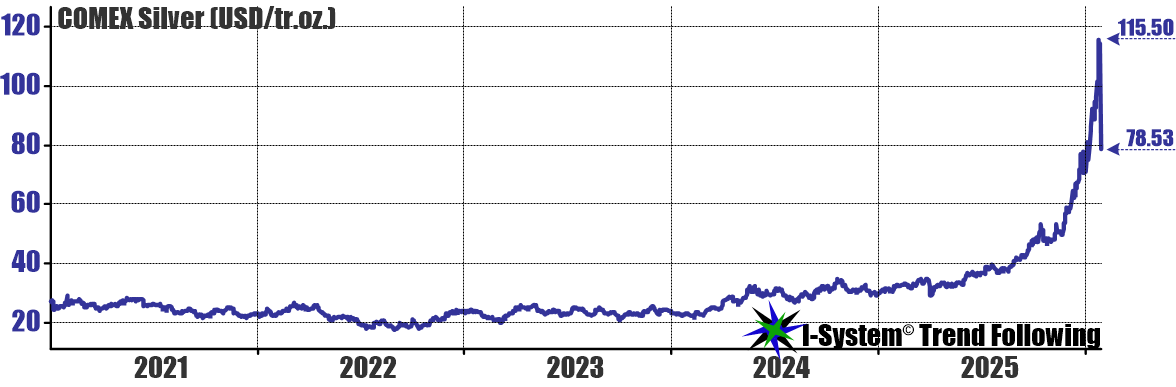
During Friday trading, silver dropped by 32% - the largest one-day crash in 46 years (largest ever in terms of USD/tr.oz.). On Thursday, 29 January silver futures (March ‘26 delivery) closed at $115.50/tr.oz. The following day, the session closed at $78.53 (a decline of $36.97/tr.oz. in 24h). But even with that, silver’s performance for the entire month of January was still +11.23%!
With this bit of hindsight clarity, it makes better sense that I-System strategies gradually exited the market and sat out a good chunk of the vertical phase silver’s rally: it went off the charts on the way up and did the same on Friday, on the way down. Even after Friday’s crash, the current price remains off the charts. If you follow financial press, they often talk about 50-day, or 200-day moving averages. At present, even the 50-day MAV is well below, at $73.31.
I-System strategies use different MAVs: 7-, 13-, 22-, 43-, 46-, 61-, and 98-day MAVS. This last one (98-day MAV) is still far below the current price at $60.72/tr.oz. As a result, it’s not too surprising that Friday’s price crash still triggered no buy signals on silver for today’s trading. It’s still insane out there and it may be better to sit tight a bit longer. In fact, this was what I recommended in last Monday’s report.
Yes, don’t throw caution to the wind!
Recall, over the weekend (24/25 January), social media was full of alarming discussions about the price of silver, related to JPMorgan’s colossal, 6.2 billion oz. short position. Supposedly, a 6 Jan. 2026 memo from the bank’s risk management department projected that a short-covering squeeze would push silver to $412/tr.oz. This could be an almost irresistible temptation for an inexperienced trader to jump in at the still low price of $110/tr.oz. and enjoy a $300+/tr.oz. windfall! On Monday 26 Jan., I wrote, “Don’t throw caution to the wind:”
“More often than not, sensational news like these tend to signify that we are very close to the near-term peak and a substantial correction could be around the corner. If you are already long gold and/or silver, consider lightering up and staying put with partial exposure. If prices go to $412/tr.oz you’ll still be rewarded. But if a punishing correction is on the cards, be sure you have plenty of dry powder to add to your positions after a 20%, 30%, or 50% pullback.”
Well, we just had a 32% pullback, but it was so sudden, it was a shock to participants and the emotions are still running raw. Trading could still go all over the place so, unless you have plenty of dry powder, plenty of nerve and stomach, and plenty of patience, best stick with the I-System’s cue and sit still until the dust settles and direction re-emerges (and systematic signals are triggered). Finally, precious metals might be last year’s news and the real news of 2026 could be the bonds armageddon, as I discussed last month.
To learn more about TrendCompass reports please check our main TrendCompass web page. We encourage you to also have a read through our TrendCompass User Manual page. For U.S. investors: an investable, fully managed portfolio based on I-System TrendFollowing is available from our partner advisory (more about it here).

Today’s trading signals
With Friday’s closing prices we have the following changes for the Key Markets portfolio:
